Overview
A product-level performance analysis system that correlates browsing behavior with purchase patterns to optimize inventory, merchandising, and promotional strategies.
The Challenge
The merchandising team was making million-dollar inventory decisions based on incomplete data and intuition rather than customer behavior insights.
Key Pain Points
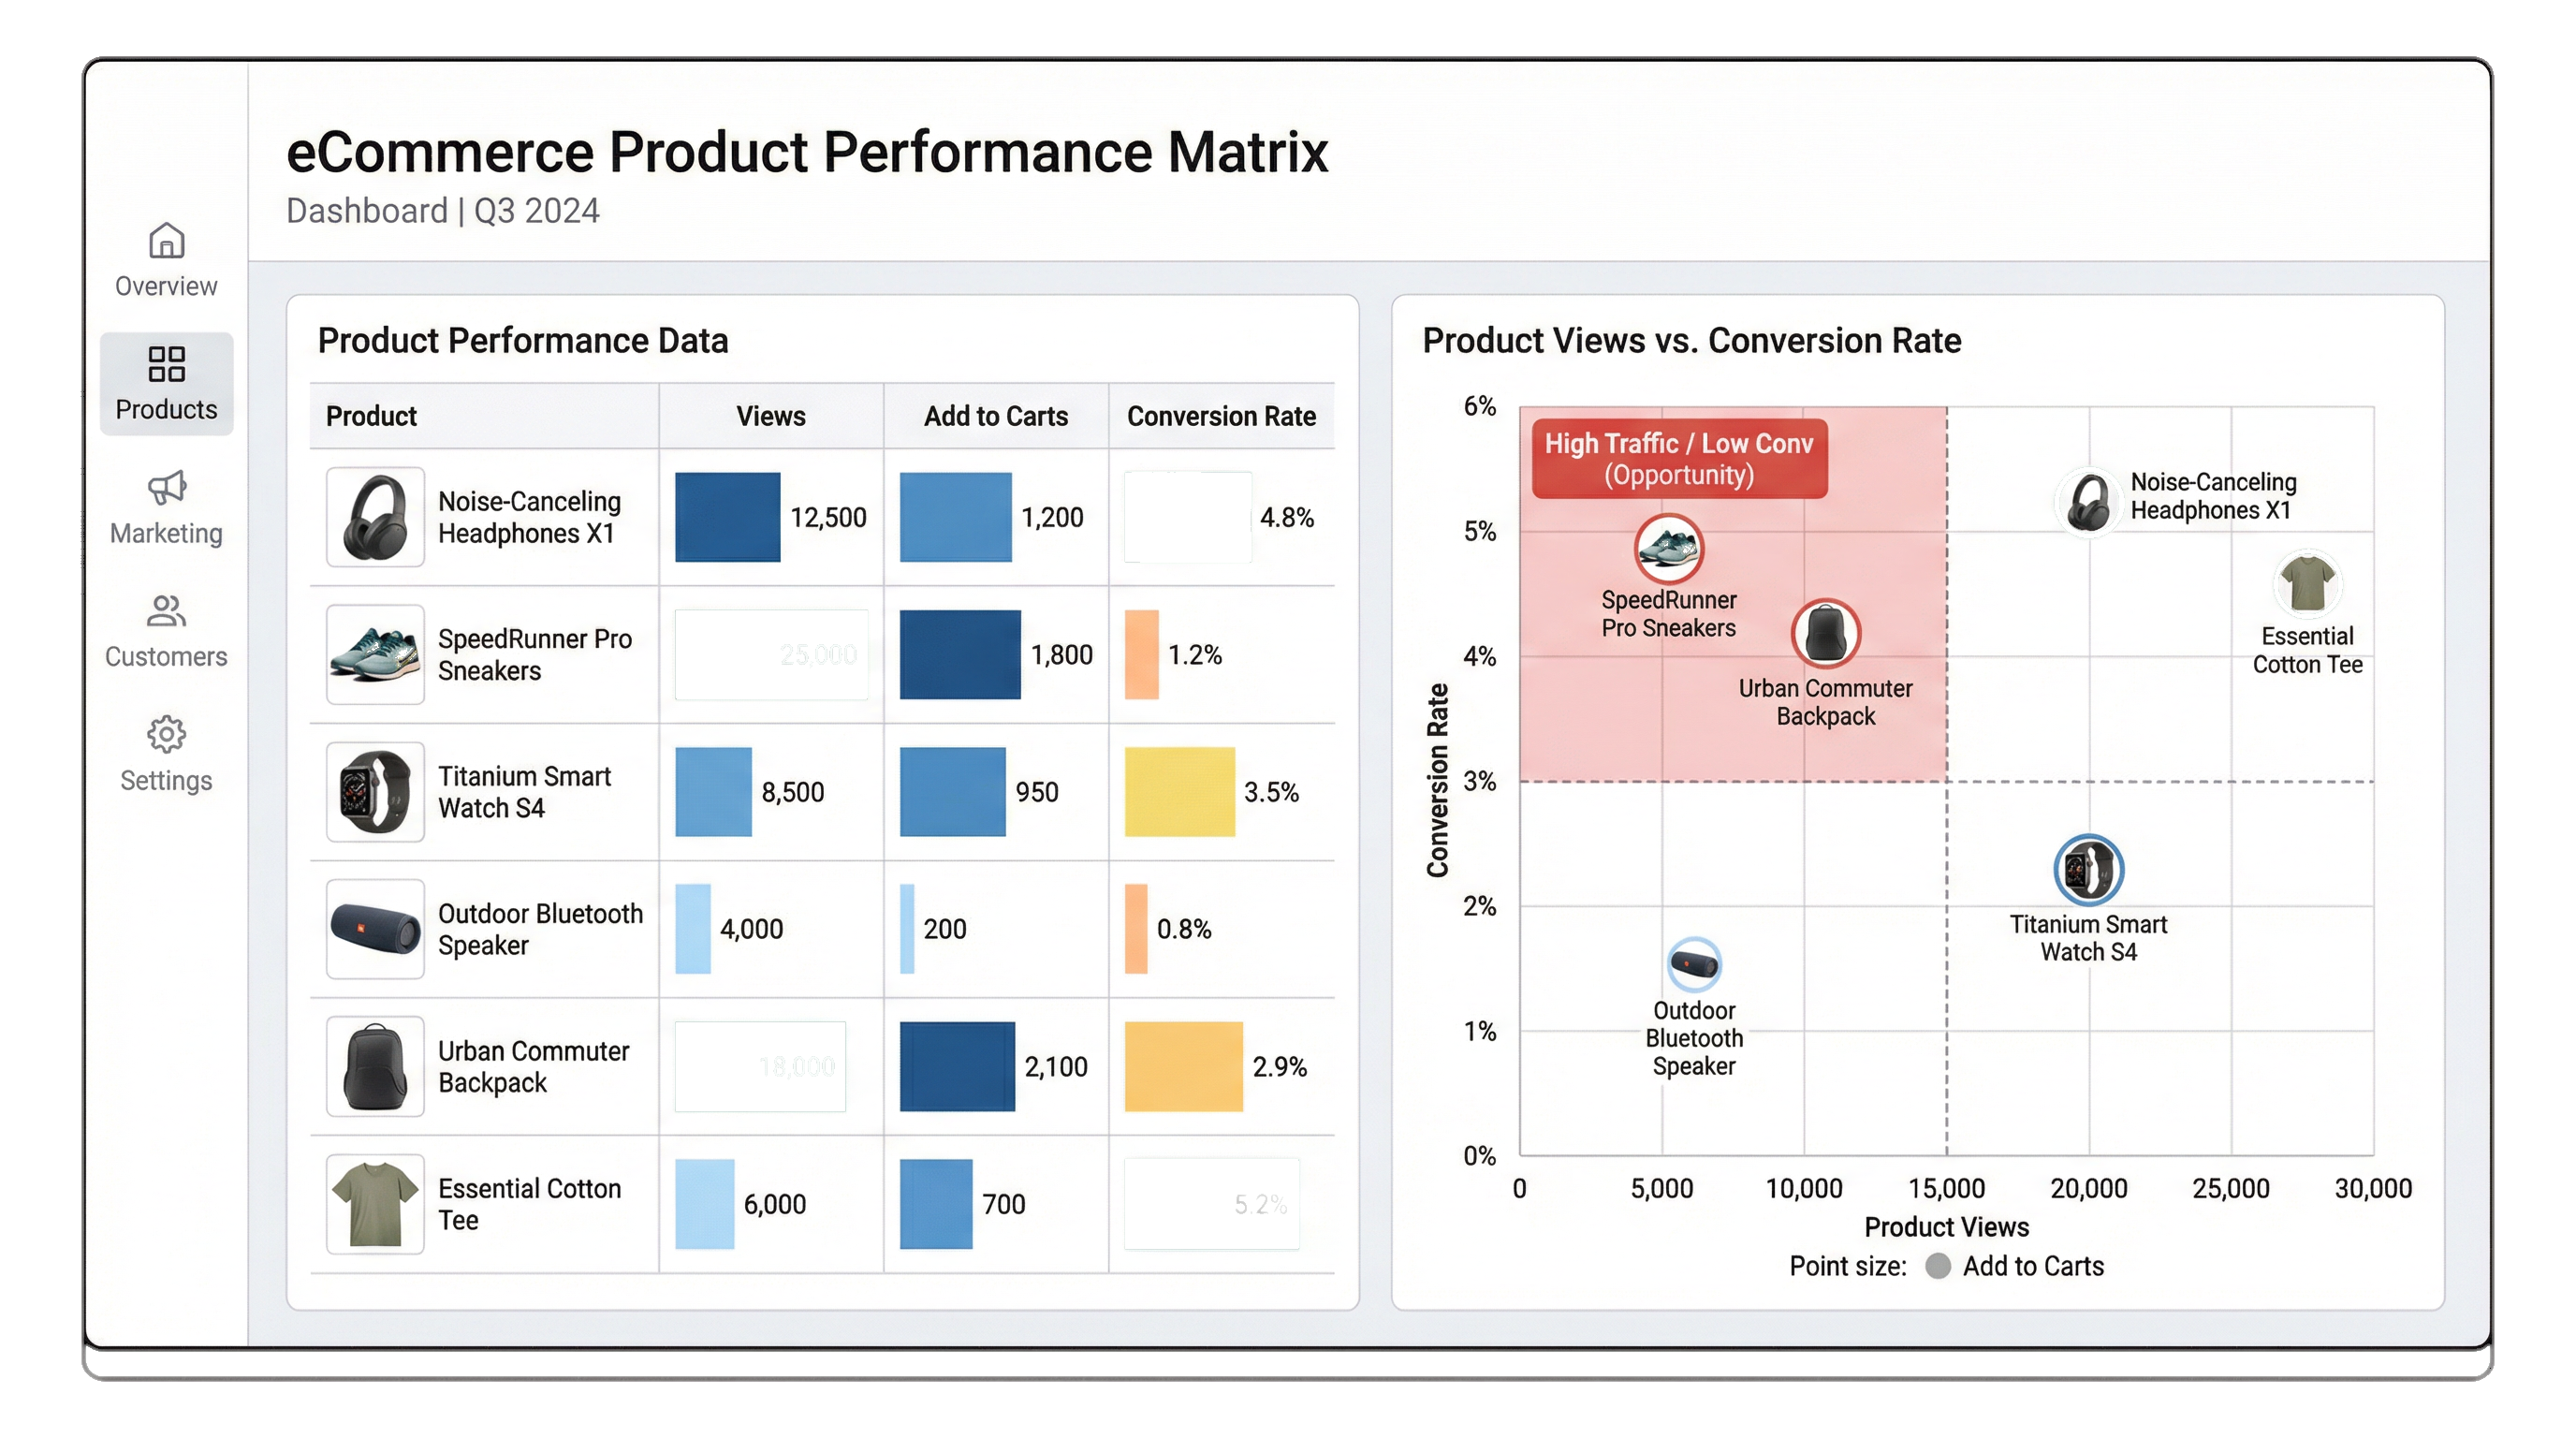
- ✕No visibility into which products had high views but low conversion
- ✕Inventory decisions based on historical sales, not demand signals
- ✕Cross-sell and upsell recommendations were random, not data-driven
- ✕Seasonal planning was reactive rather than predictive
- ✕Product page performance varied wildly with no clear understanding why
- ✕Markdowns were applied too late, eroding margins
Business Impact: Excess inventory and missed opportunities were costing an estimated $200K annually in markdowns and lost sales.
The Solution
I built a comprehensive product analytics system that connects browsing behavior to purchase outcomes and inventory planning.
Data Integration
Connected GA4 enhanced ecommerce events with inventory management system and POS data to create a unified product performance view.
Performance Matrix
Developed a Product Performance Matrix that plots products on View-to-Purchase conversion vs. Revenue contribution, identifying Stars, Question Marks, Cash Cows, and Dogs.
Recommendation Engine
Analyzed co-browsing and co-purchase patterns to build data-driven product recommendation rules for cross-sell and upsell.
Demand Forecasting
Created predictive models using historical patterns and current browsing trends to forecast demand 4-6 weeks ahead.
Tech Stack
The Results
The system transformed merchandising from an art to a science, with measurable improvements across all key metrics.
"We used to guess which products would sell. Now we know weeks in advance. It's completely changed how we plan our buys."
Key Learnings
Product analytics is only valuable if merchandisers can act on it quickly
Combining behavioral data with inventory data unlocks insights neither has alone
Visualization matters - the best analysis is useless if stakeholders can't understand it